6.1 A model of allergies
Our primary goal is to improve our understanding of allergy development, as it relates to childhood asthma, by looking for patterns in the MAAS data. To understand the relevant data in the study, we need to learn a little bit about diagnosing allergies. The doctors in the study used two types of test to try to detect if a person is allergic to a specific allergen, such as cat hair or peanuts. The two types of test were:
- A skin prick test where a drop of allergen solution is placed on the patient’s skin (see image) which is then pricked with a needle. If the skin shows an immune response in the form of a red bump of a certain size, then the test is positive, otherwise it is negative.
- An allergen-specific IgE test – this is a blood test that looks for a kind of antibody called Immunoglobulin E (IgE) that specifically targets a particular allergen. The presence of this antibody is an indicator that the patient is allergic to that allergen. If this antibody is present in sufficient quantities the test is positive, otherwise negative.
If a child has a positive skin prick test or IgE test for an allergen, then they are said to be sensitized to that allergen.
For the children taking part in this study, both of these tests were performed for eight allergens: dust mite, cat, dog, pollen, mould, milk, egg and peanut. So that the development of allergies could be tracked over time, the tests were repeated at different ages (1, 3, 5 and 8). Therefore, the available data points are the two test results for each allergen, for each child, at each of the four ages.
The clinicians on the study believe that different patterns of allergies make children susceptible to different diseases, some of which may have significant impact on the child’s health (such as severe asthma) and some of which may be more benign (such as mild hayfever). The goal of the project is to identify such patterns and see if they are indicative of developing particular diseases and of the severity of the disease. Our task is to develop a model of the allergen data set that can achieve this.
Modelling test results
To start with, let’s consider a model of a child’s test results for one allergen at one point in time. First, we need variables for the results of each test – we will call these skinTest and igeTest. These variables will be true if the corresponding test is positive and false if the test is negative.
Remember that the purpose of these tests is to try and detect whether a child is actually sensitized (allergic) to a particular allergen. However, the tests are not perfectly consistent – for example, it is not unusual for a child to have a positive IgE test but a negative skin test. To cope with such inconsistencies, we can have a variable representing whether the child is truly sensitized to the allergen, which we will call sensitized. This variable will be true if the child is actually sensitized to the allergen and false if they are not sensitized. We then allow for the results of the tests to occasionally disagree with the value of this variable. In other words, we assume that each test can give a false positive (where the test is positive but the child is not sensitized) or a false negative (where the test is negative but the child is sensitized).
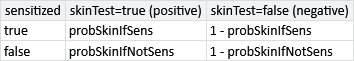
If a child is sensitized to a particular allergen (sensitized=true), then a skin prick test will be positive (skinTest=true) with some probability, which we will call probSkinIfSens. Since we expect the test to be mostly correct we would expect this probability to be high but less than one, since a skin prick test can give false negatives. Conversely, even if a child is not sensitized to a particular allergen (sensitized=false), then we might occasionally expect a skin prick test to be positive, but with some low probability probSkinIfNotSens. Although this probability is low, we still expect it to be greater than zero because a skin prick test can give false positives.
These two probabilities together define a conditional probability table for skinTest conditioned on sensitized.
We have introduced these two probabilities as random variables in our model because we will want to learn them from data, in order to determine the false positive and false negative rates for the skin prick test. In order to learn their values, we must provide suitable prior distributions for each variable, that encode our assumptions about them. Let’s write down those assumptions:
- If a child is sensitized to a particular allergen, there is a high probability that they will get a positive test.
- If a child is NOT sensitized to a particular allergen, there is a low probability that they will get a positive test.
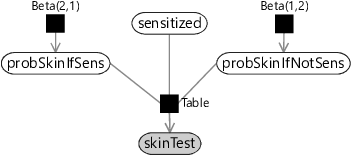
As in section 2.6, we can use beta distributions as prior distributions over probabilities that can represent these assumptions. Assumptions0 6.1 says that we expect probSkinIfSens to be high so we can use a Beta(2,1) prior which favours higher probability values. Assumptions0 6.2 says that we expect probSkinIfNotSens to be low so we can use a Beta(1,2) prior which favours low probability values. Armed with these prior probabilities, we can now draw a factor graph for a skin test, using the Table factor that we introduced back in section 2.6.
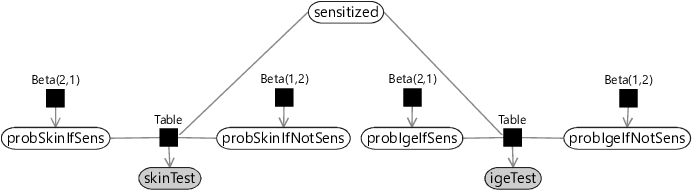
Now that we have a model for a skin test, we can add in the corresponding model for an IgE test. We again need probability variables for the probability of a positive test if sensitized probIgeIfSens and if not sensitized probIgeIfNotSens with the corresponding beta distribution priors. The sensitized variable is shared between the two tests, because both tests are attempting to detect the same underlying sensitization. The resulting factor graph for both tests is shown in Figure 6.2.
Inference in this model enables us to fuse the outcomes of both tests into a single underlying sensitization state. Learning the probabilities of true and false positives will let the model learn which test to pay most attention to. For example, if a test has a high false positive probability, then a positive outcome would influence the inference of the sensitization state less than a positive outcome for a test with a low false positive probability.
Modelling tests through time
For each child, we have test measurements at multiple points in time – ages 1, 3, 5 and 8. Such a collection of measurements is known as a time series, and analysis of such data is known as time series analysis. To understand the development of allergies, we need to build a model of a time series of allergy test results.
We could start building a time series model by duplicating the factor graph of Figure 6.2 at each time point. This would introduce a separate sensitized variable at each age, which we could call sensitized1, sensitized3, sensitized5 and sensitized8. It would also introduce separate test result variables at each age, which we could similarly call skinTest1, igeTest1, skinTest3, igeTest3 and so on. However, directly duplicating the factor graph would also mean having separate variables at each time point for the probability of a positive test given sensitized/not sensitized. Do we really expect the false positive and false negative rates for the tests to change over time? If exactly the same tests were done at each age, it would be reasonable to assume that the false positive and false negative rates did not change over time. Let’s write down this assumption:
- For each type of test, the false positive and false negative rates are the same for all such tests carried out in the study.
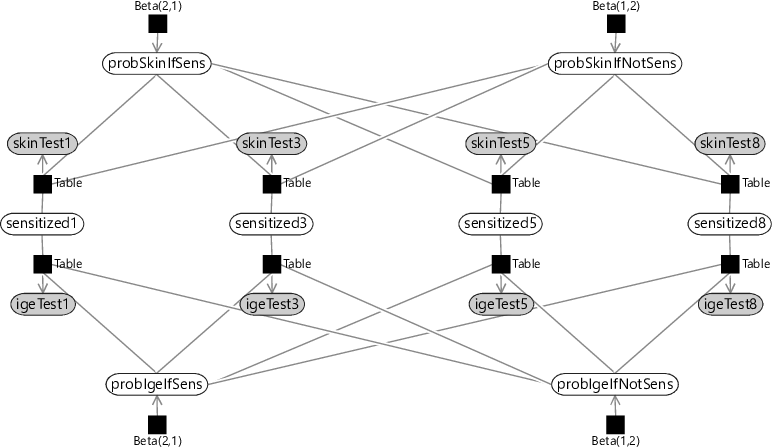
The consequence of this assumption is that the skin test probability variables (probSkinIfSens, probSkinIfNotSens) and the IgE test probability variables (probIgeIfSens, probIgeIfNotSens) will be shared across all time points. The result of this sharing is the factor graph of Figure 6.3.
You might wonder why we have drawn out the variables for each time point, rather than use a plate to collapse them all together. This is because, when modelling time series, we expect variables later in time to depend on the values of variables earlier in time. By drawing out all variables, we can now add factors connecting variables across time. But what should these factors be?
At age 1, there is a certain initial probability that a child will already be sensitized to a particular allergen – let’s call this probSens1. Now, suppose the child is not sensitized at age 1 (sensitized1=false), there is some probability that they will become sensitized by age 3 – let’s call this probGain3. Conversely, if the child is sensitized at age 1 (sensitized1=true), there is some probability that they retain that sensitization to age 3 – let’s call this probRetain3. We can model this using a Table factor, just as we did for modelling the skin and IgE tests.
When we consider age 5, we need to ask ourselves a question: do we think that the sensitization at age 5 depends on both previous sensitizations (at ages 1 and 3), or just the most recent one (at age 3). Similarly, do we think that sensitization at age 8 depends on all three previous sensitizations (at ages 1, 3 and 5) or just the most recent one (at age 5). Either of these assumptions might be reasonable, depending on the details of how the immune system functions. For now, we will assume that just the most recent sensitization is relevant, since that simplifies the model the most:
- Whether a child is sensitized to an allergen at a particular time point depends only on whether they were sensitized to that allergen at the previous time point.
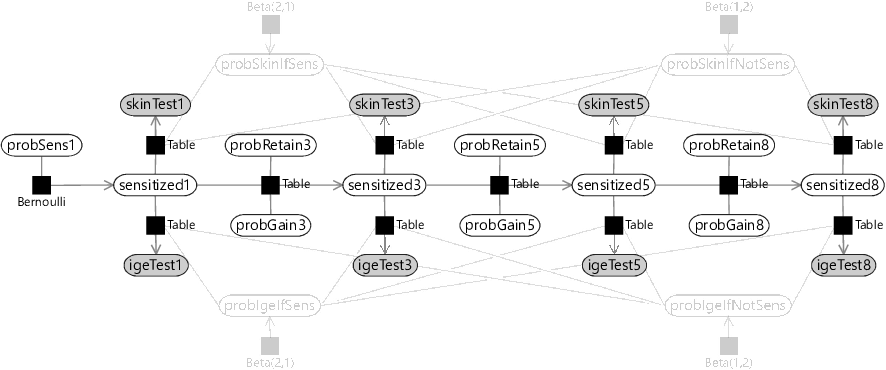
This kind of assumption is so common in time series modelling that it even has a name – it is called a Markov assumption after the Russian mathematician Andrey Markov. Our Markov assumption means that we can model sensitization at ages 5 and 8 just like we did at age 3. So for age 5, we have variables probGain5 and probRetain5 for the probabilities of gaining or retaining sensitization between the ages of 3 and 5. Similarly, for age 8, we have variables probGain8 and probRetain8 for the probabilities of gaining or retaining sensitization between the ages of 5 and 8. As for age 3, we can model sensitivity at ages 5 and 8 using a Table factor, giving the factor graph of Figure 6.4.
Looking at Figure 6.4, you can see the chain of factors connecting the sensitization variables through time, from sensitized1 through to sensitized8. This kind of chain structure is a common feature of time series model that make Markov assumptions, and so is called a Markov chain.
Completing the model
To complete our time series model, we need to extend it to cover multiple allergens and multiple children. We can add plates for allergens and children and place the sensitization and skin/IgE test variables inside both plates, since there are tests and sensitization states for every child and allergen. Assumptions0 6.3 says that the false positive and false negative rates of our tests are the same throughout the study, and so the variables probSkinIfSens, probIgeIfSens, probSkinIfNotSens and probIgeIfNotSens lie outside both plates. This leaves only the variables relating to the probability of initial having, gaining and retaining sensitization. We want these variables to be able to vary between allergens, so we can learn if different allergies are gained or lost at different points in time. So these variables must lie inside the allergens plate. But if we are trying to learn patterns of gaining or losing sensitization that are common to multiple children, we must have these probability variables shared across children. Right now, the only way of doing this is to place them outside the children plate. This corresponds to the following assumption, which is the final assumption of the model:
- The probabilities relating to initially having, gaining or retaining sensitization to a particular allergen are the same for all children.
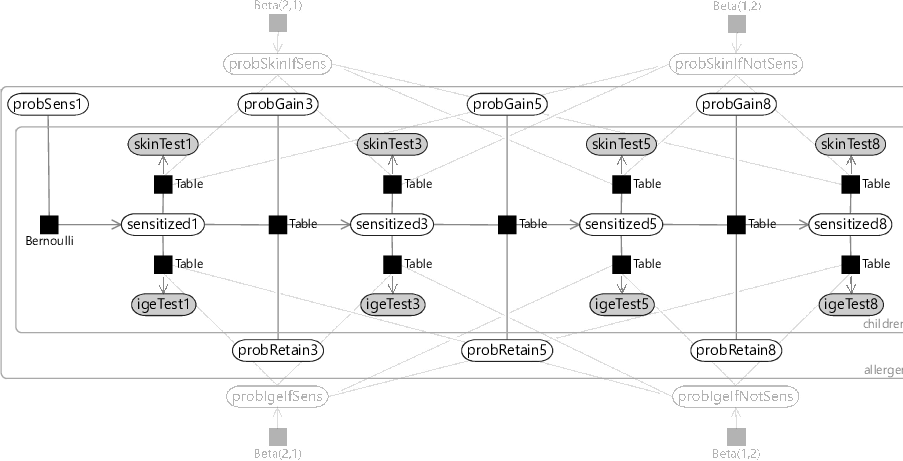
Given this assumption, we can now draw the factor graph with plates, where the variables have been appropriately placed inside or outside each plate (see Figure 6.5).
Reviewing Figure 6.5, you can see that:
- the test false positive/false negative probabilities are outside both plates and so are shared across all children and allergens;
- the probabilities of initially having, gaining and retaining sensitization are inside the allergens plate but outside the children plate, so are shared across children but can differ across allergens;
- the test results and sensitization are inside both plates, since there are tests and sensitization states for each child and allergen.
Given these plates, we now have a complete model that we can use with our data set of skin and IgE test results.
Reviewing our assumptions
As in previous chapters, we should take a moment to review our modelling assumptions. They are shown all together in Table 6.2.
- If a child is sensitized to a particular allergen, there is a high probability that they will get a positive test.
- If a child is NOT sensitized to a particular allergen, there is a low probability that they will get a positive test.
- For each type of test, the false positive and false negative rates are the same for all such tests carried out in the study.
- Whether a child is sensitized to an allergen at a particular time point depends only on whether they were sensitized to that allergen at the previous time point.
- The probabilities relating to initially having, gaining or retaining sensitization to a particular allergen are the same for all children.
Table 6.2The five assumptions encoded in our allergy model.
Assumptions0 6.1 and Assumptions0 6.2 seem to be safe assumptions – doctors would not use these tests if they were not correct most of the time. Assumptions0 6.3 seems like a plausible assumption, but we might worry that the tests have different false positive/false negative rates for different allergens. It might also be possible that the test was improved or updated during the study and so that the rates would change over time. To check this out we consulted with the MAAS clinicians and they confirmed that the tests were performed exactly the same way throughout the study – the same test methodology, the same allergen solutions, even the same person doing the tests! So it seems like this assumption is a relatively safe one.
Assumptions0 6.4 is our Markov assumption – this is a common simplifying assumption but is also commonly criticised as being too simplistic. For example, in our case, it says that the probability of gaining/retaining sensitization depends only the sensitization state at the previous time point and not, for example, on how long the child has had the sensitization (or lack of sensitization). Nonetheless, this assumption keeps the model simple and so we will stick with it.
Finally, Assumptions0 6.5 says that all children have the same patterns of gaining and losing sensitization. This assumption goes against the very purpose of the project, which is to identify how these patterns vary between children. We will spend much of the rest of this chapter looking at how to improve on this assumption, but it is useful to keep it in place for now so we explore the behaviour of our new model.
Review of concepts introduced on this page
allergenA substance which someone can be allergic to, such as cat hair or peanuts.
skin prick testA test where a drop of allergen solution is placed on the patient’s skin, which is then pricked with a needle. If the skin shows an immune response in the form of a red bump of a certain size, then the test is positive, otherwise it is negative.
IgE testA blood test that looks for a kind of antibody called Immunoglobulin E (IgE) that specifically targets a particular allergen. If this antibody is present in sufficient quantities the test is positive, otherwise negative.
time seriesA series of data points, listed in time order, that represent the measurement of some quantity over time – such as a stock price, blood pressure or population counts.
time series analysisAnalysis of a time series, so as to understand the time-varying process underlying the time series data.
Markov assumptionThe assumption that a state of a process depends only on the previous state of that process, and not any earlier states. Named after the Russian mathematician Andrey Markov.
Markov chainA random process such that the probability distribution of the next state depends only on the previous state and not on any earlier state. In a factor graph, a Markov chain appears as a chain of time series variables with adjacent variables connected by factors.